Easy charting with Gnuplot
Lastly I had to prepare simple chart for some physic laboratory. It was only a bunch of points, and fitted function. At first I tried GDocs but it wasn’t designed for it. Then I switched to LibreOffice Calc, but I have some problems with defining data sets and can’t get desired shape of chart. I also tried gnumeric but it crashed just after star so I search for another solution. I hear d about gnuplot, but wait I need only to put some points with their errors, do I really need a console tool? I tried and it was not hard and IMO easier than countless options in never ending graphical wizards since you must really know what you want to achieve.
My data looks like this and were stored in external CSV file.
41.6	200	5.002	17.5	30	0.3	420.673076923077
39.5	200	4.75	16.5	30	0.3	417.721518987342
36.4	200	4.378	15.5	30	0.3	425.824175824176
33.2	200	3.994	14	30	0.3	421.686746987952
31.3	200	3.766	13.5	30	0.3	431.309904153355
29	200	3.49	12.5	30	0.3	431.034482758621
26.9	200	3.238	11.5	30	0.3	427.509293680297
24.2	200	2.914	10.5	30	0.3	433.884297520661
21	200	2.53	8.4	10	0.1	400
17.88	20	0.904	7.8	10	0.1	436.241610738255
15.36	20	0.778	6.4	10	0.1	416.666666666667
11.96	20	0.608	5.2	10	0.1	434.782608695652
8.74	20	0.447	3.8	10	0.1	434.782608695652
6.47	20	0.3335	2.8	10	0.1	432.766615146832
4.52	20	0.236	1.9	3	0.03	420.353982300885
2.24	20	0.122	0.94	1	0.01	419.642857142857
0.88	2	0.054	0.34	0.1	0.001	386.363636363636
Firstly I need to load my data from file. Sounds easy and in fact it was. But gnuplot use it’s own standard of csv (tab separated) so it wasn’t big deal to change it with sed. I wanted to display values from first and fourth column.
plot 'data.tsv' using 4:1:
Ok, now a little bit harder. I’ve got error for every entry stored in 6th and 3th column. I only added this column and proper flag to get nice error marks around my points.
plot 'data.tsv' using 4:1:6:3 w xyerrorbars
Whats next? Function that fit my measurements best. Actually I know that it should be line function. I jut declare it and let gnuplot do rest.
f(x) = a*x+b
fit f(x) 'data.tsv' u 4:1 via a,b
Output:
Final set of parameters            Asymptotic Standard Error
=======================            ==========================
a               = 2.34032          +/- 0.234        (9.998%)
b               = -0.335747        +/- 2.387        (710.9%)
Wow, I get parameters with errors, That’s what I have been searching for. So now I only draw it on the same chart as the points
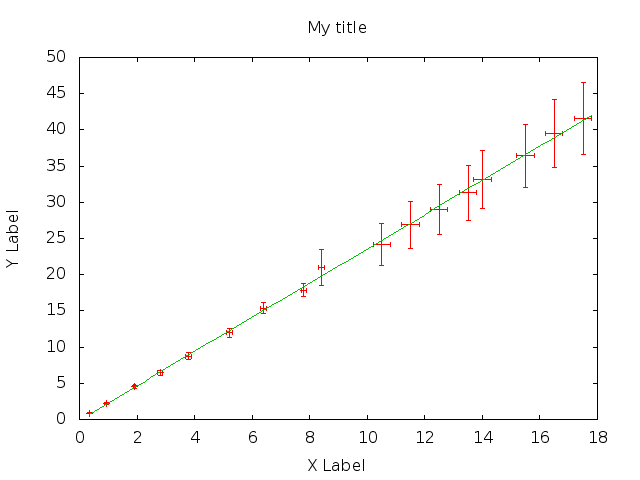
plot 'data.tsv' using 4:1:6:3 w xyerrorbars, f(x)
Now I need to customize my chart. I need to set labels, change title and remove legend since I have only one serie of data and title perfectly describe what’s in the picture.
set title  "My title"
set xlabel "X Label"
set ylabel "Y Label"
set key off;
You can sepcify font for each text but I was totally stysfied with default style. At the end I need only save my work in PNG file whitch was the hardest thing I need to cope with because it require 3 lines
set term png
set output "output.png"
replot
Oh, and one more thing I saved my workspace to use it later
save 'plot1.gnu'
And the final result